On the 10th anniversary of his involvement with the Gates Foundation, Warren Buffet wrote a letter to Bill and Melinda Gates asking them to reflect on their progress achieving their goals at the head of world’s largest foundation. In his letter Buffett mentions that “success in philanthropy is measured differently from success in business or government.” In response, the Gateses quantified some extraordinary ways their work (and his gift) have impacted the world, from a dramatic decrease in infant mortality to the impending eradication of polio globally. The Gateses wrote that the Buffett gift was “the biggest single gift anyone has given anybody for anything,” which doubled the foundation’s resources and helped the foundation make progress in its issue areas.
While it is true that it was the biggest gift ever, another factor has had an even bigger effect on the foundation’s resources — investment performance.
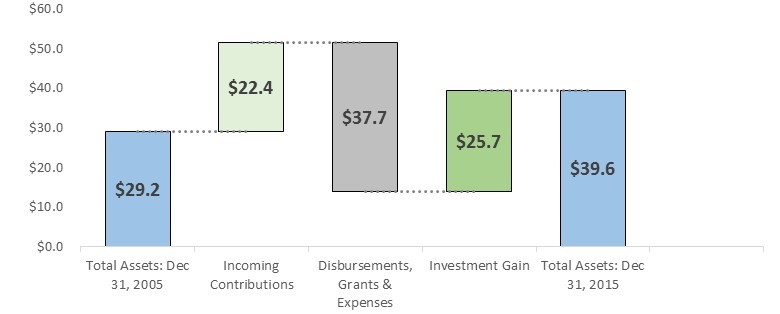
Although foundations are not required to report investment returns. FoundationMark, the organization I founded and lead, uses data drawn from publicly available documents to estimate investment performance. For the Gates Foundation, FoundationMark estimates that over 10 years, investment returns have added $25.7 billion to the foundation’s assets.
The chart below summarizes the evolution of the foundation’s assets from 2005, just before Buffett announced his intention to fund Gates, through 2015, the most recent year’s tax filing. The foundation began the period with $29.1 billion in total assets; a decade later, assets had grown to $39.6 billion — a gain of over $10 billion. Over the period, the foundation received $22.4 billion in new contributions (Buffett put in $17.3 billion and the Gateses added $5.1 billion) and paid out $37.7 billion in grants and expenses (nearly $4 billion a year) to end the period with $39.6 billion in assets, implying $25.7 billion in investment gains in the decade since Mr. Buffett got involved.
Figure 1 ($ in billion)

The chart makes it easy to see the scope that investment performance can have on foundation resources — money that will lead to future grants and disbursements. The $25.7 billion gain is greater than the $22.4 billion that Buffett and Gates donated over the period and represents over 60 percent of the $39.6 billion in total assets at December 31, 2015.
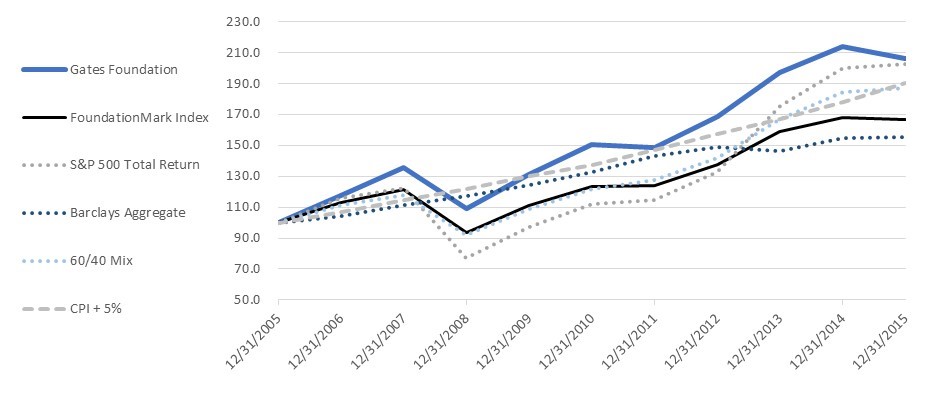
How does the Gates Foundation investment compare to others and the broad market averages? Unlike philanthropic success, investment success is much more straightforward to measure. The Gates Foundation ranked in the top quartile of the FoundationMark universe for the 10-year period, and outperformed the average foundation by over two percent per year.
The chart below shows the Gates Foundation’s performance as estimated by FoundationMark over the 10-year period to December 31, 2015 (2016 data is due to be released this month) in comparison to the S&P 500 Total Return Index, the Bloomberg Barclays Aggregate Index (bond market), a mix of 60 percent equities/40 percent bonds, CPI +5% (a proxy for maintaining inflation adjusted purchasing power), and the FoundationMark Dec Index which measures the returns of private foundations. The Gates Foundation outperformed every benchmark for the 10-year period.
Figure 2

(Note: The information is from the Bill & Melinda Gates Foundation Trust, which manages the endowment assets. 2005 is shown as the base year with a value of 100.)
While long term charts like Figure 2 are useful in demonstrating comparative performance, the dollar impact of investment returns can be even more compelling; if the Gates foundation had been invested in a 60/40 mix, it would be $5.5 billion lower, and if the foundation had merely performed in line with the median foundation, it would be nearly $11 billion smaller and would have lower assets than the beginning of the period in 2005.
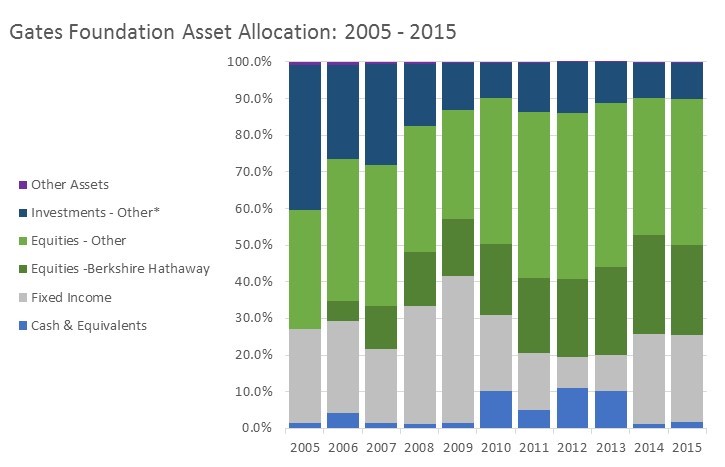
What factors contributed to the Gates Foundation’s outperformance? While the data in the public filings does not provide enough information for a thorough attribution analysis, it does suggest that security/manager selection played a large part. The chart below of the Gates Foundation’s asset allocation over the 10-year period shows that the foundation increased its exposure to public equities from 32.4 percent to 64.5 percent. Within the equity category, Berkshire Hathaway increased from a negligible position to nearly 25 percent of total assets, effectively placing Warren Buffett in charge of a quarter of assets, which contributed to the foundation’s outperformance. As equities rose, the amount of the portfolio allocated to “Investments – Other,” which contains private equity, hedge funds, real estate securities, futures, options, and other investment vehicles, declined from about 40 percent to 10 percent.
Figure 3

Simply put, better investment performance leads to greater resources that foundations can deploy toward their and their grantees’ shared goals.
The Gates Foundation is far and away the largest private foundation in existence, and yet it represents less than 5 percent of total foundation assets. If the performance of the other 95 percent of total assets were to improve even slightly, it could have the effect of adding tens of billions of dollars in additional resources for nonprofit organizations working to solve our greatest societal and environmental challenges.
John Seitz is founder and CEO of FoundationMark, which estimates investment returns of more than 40,000 foundations that account for 97 percent of total foundation assets, and uses these estimates to build comprehensive indices and representative peer groups for the use of foundation trustees, officers, and the larger foundation community. If you are a foundation trustee or officer and would like a complimentary report of your foundation’s performance, please request it here.
Editor Note: At the time of this post’s publication, 2016 data was not available. Subsequently, FoudationMark estimates the Bill & Melinda Gates Foundation investments returned 9.9 percent in 2016, well ahead of the foundation index, which returned 7.2 percent. Estimated investment gains were $3.9 billion for the year.


